Dashboard
Your home screen: see key numbers, alerts, and recent activity at a glance, then jump straight to whatever needs attention.
Last updated on June 25, 2026
The Dashboard is the first screen you see when you sign in. It pulls the most important numbers, charts, and alerts from across your whole system into one place, so you can tell how things are going in a few seconds and then click straight through to whatever needs your attention. You do not enter data here. Think of it as your daily starting point.
What you see is tailored to you. A card, chart, or alert only appears if you have permission to view that information and the related module is switched on for your organization. So your dashboard may look a little different from a colleague's, and that is normal.
Read your dashboard at a glance
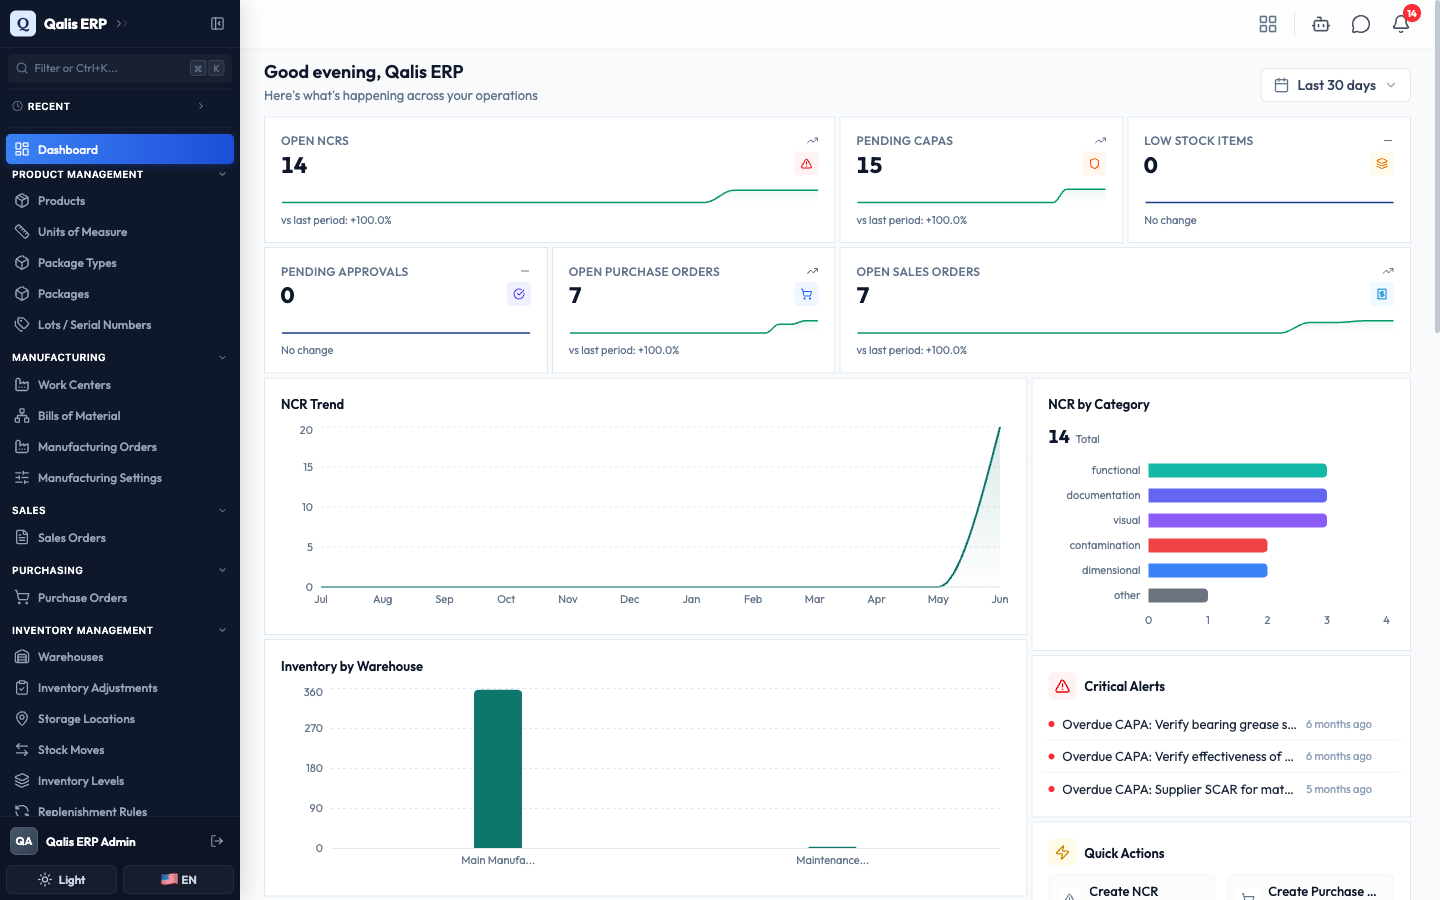
This is the whole picture in one view: a greeting, a row of key numbers, charts, alerts, and shortcuts.
When you open the app you land here automatically. You can also return any time by clicking Dashboard at the top of the left sidebar.
At the very top you are greeted by name (for example, "Good evening, Sarah") with the line "Here's what's happening across your operations".
The key numbers (KPI cards)
The row of cards near the top is your scorecard. Each card shows a single important number, a small graph of how it has been moving, and a note comparing it to the previous period (such as "vs last period" or "No change").
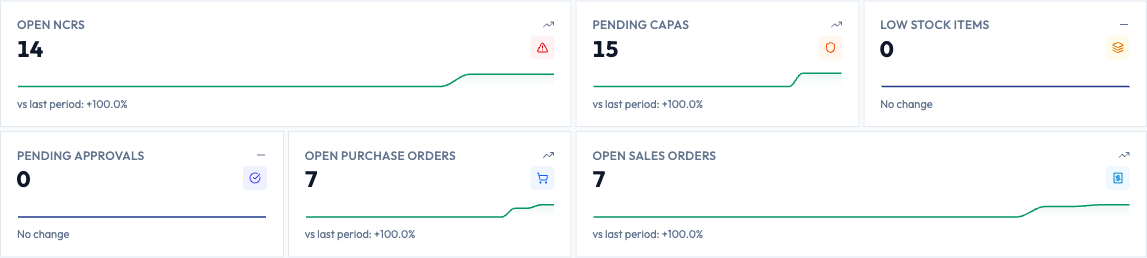
| Card | What the number tells you |
|---|---|
| Open NCRs | Non-conformance reports that are still active (not closed or cancelled) |
| Pending CAPAs | Corrective and preventive actions that are still open |
| Low Stock Items | Products that have run out or have nothing left to use |
| Pending Approvals | Requests that are waiting for someone to approve or reject |
| Open Purchase Orders | Purchase orders still in progress (not yet received or cancelled) |
| Open Sales Orders | Sales orders still in progress (not yet delivered or cancelled) |
Tip: each card is a shortcut. Click any card to open the full list behind that number. For example, clicking Open NCRs takes you to the non-conformance reports list.
Choose the time period
Decide how far back the dashboard should look. This changes the numbers, the trend lines, and the comparisons.
- Find the period button in the top right corner. It shows the current choice, such as Last 30 days.
- Click it to open the list of choices.
- Pick the window you want: Today, Last 7 days, Last 30 days, Last 90 days, Year to date, or Last 12 months. A check mark shows the one in use.
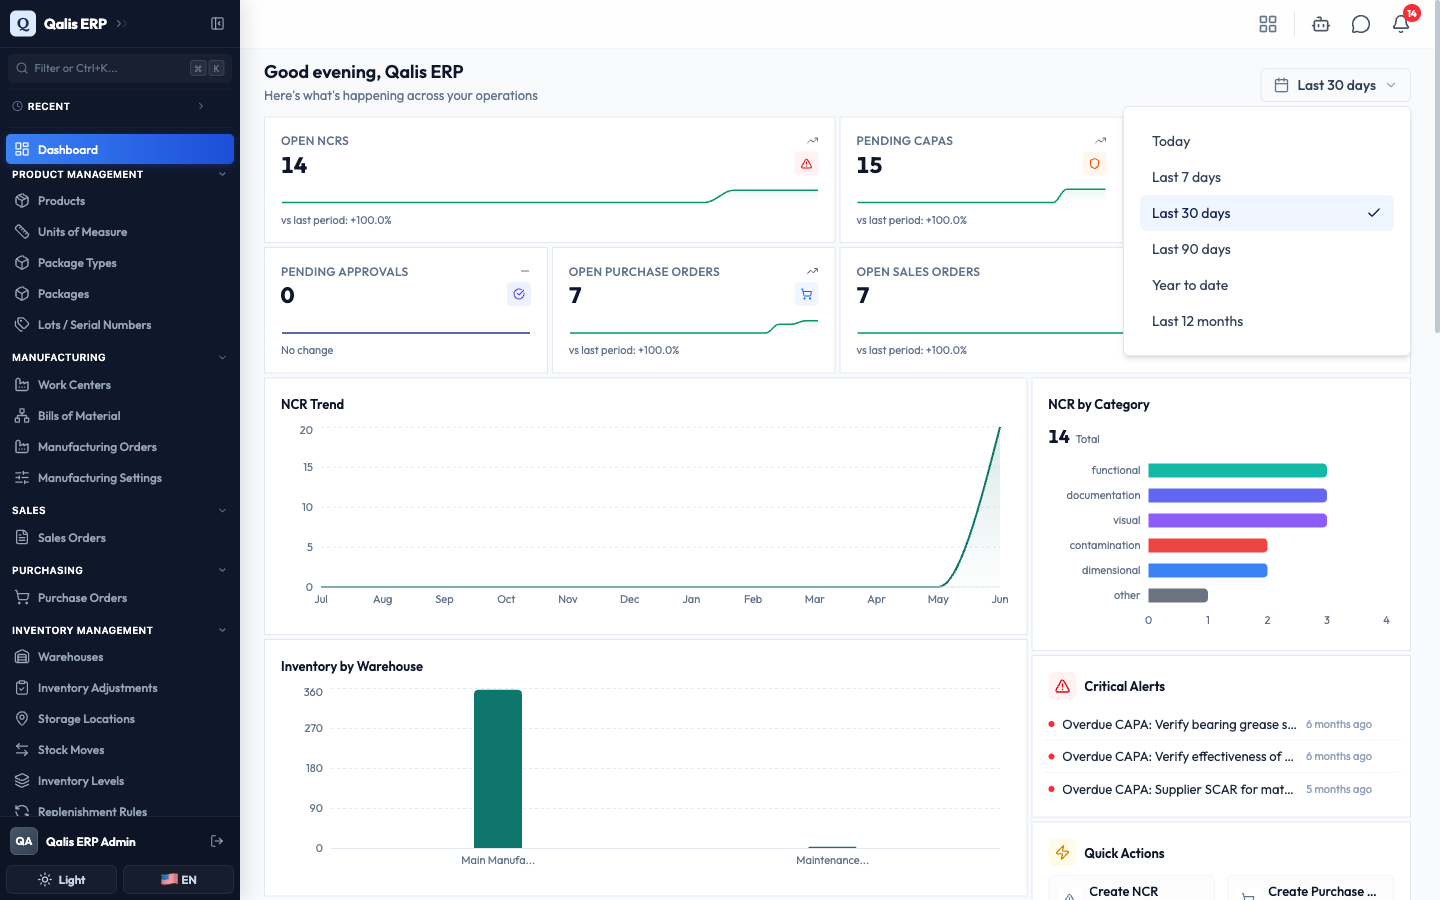
The dashboard refreshes for the period you pick. Your choice is also saved in the page address, so you can bookmark a particular view or paste the link to a colleague and they will see the same window.
The dashboard keeps itself up to date on its own, refreshing every minute, so you do not need a refresh button. Just leave it open.
Read the charts
The charts turn your data into a picture so trends and problem areas jump out.
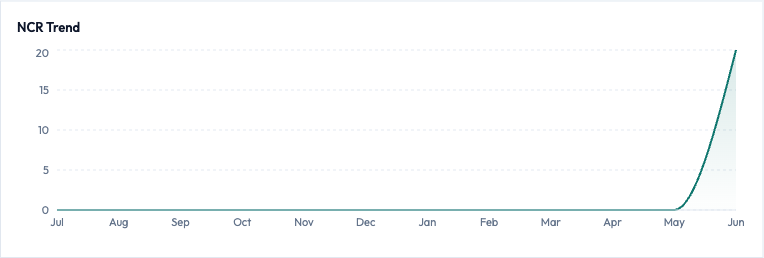
NCR Trend shows how many non-conformance reports were raised each month over the last year. A rising line means quality issues are increasing over time, a falling line means they are easing.
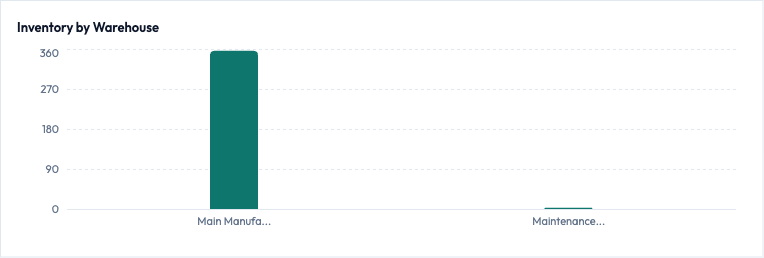
Inventory by Warehouse shows how much stock is held in each warehouse, so you can see at a glance where your inventory sits.
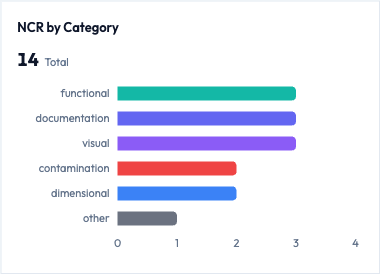
NCR by Category breaks your open non-conformances down by type (functional, documentation, visual, and so on), so you can see where most problems are concentrated. Hover over any bar to see the exact count and percentage.
Act on critical alerts
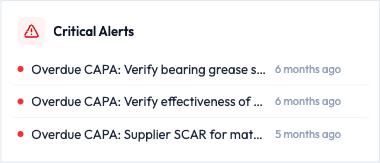
The Critical Alerts panel gathers the most urgent issues that need someone to step in, with the most serious shown first.
Alerts can include:
- Overdue CAPAs: corrective actions whose due date has already passed.
- Low or zero stock: products that have run out.
- Expiring lots: tracked batches that will expire soon.
Click any alert to jump straight to the record it is about, so you can deal with it right away. If there are a lot of alerts, a View All link appears so you can see the complete list.
If you have approval requests waiting on you, a Pending Approvals panel also appears here, listing what needs a decision and who asked for it. Click a request to open it and review it in full.
Create records fast with Quick Actions
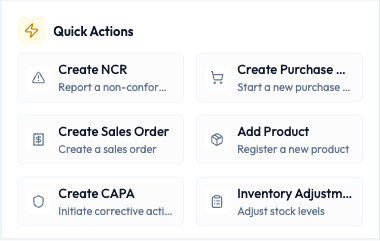
Quick Actions are one-click shortcuts to start the things you create most often, without hunting through the menus.
- Find the Quick Actions panel (lower right of the dashboard).
- Click the action you need, such as Create NCR, Create Purchase Order, Create Sales Order, Add Product, Create CAPA, or Inventory Adjustment.
The matching creation form opens, ready for you to fill in. For example, Create NCR opens a fresh non-conformance report.
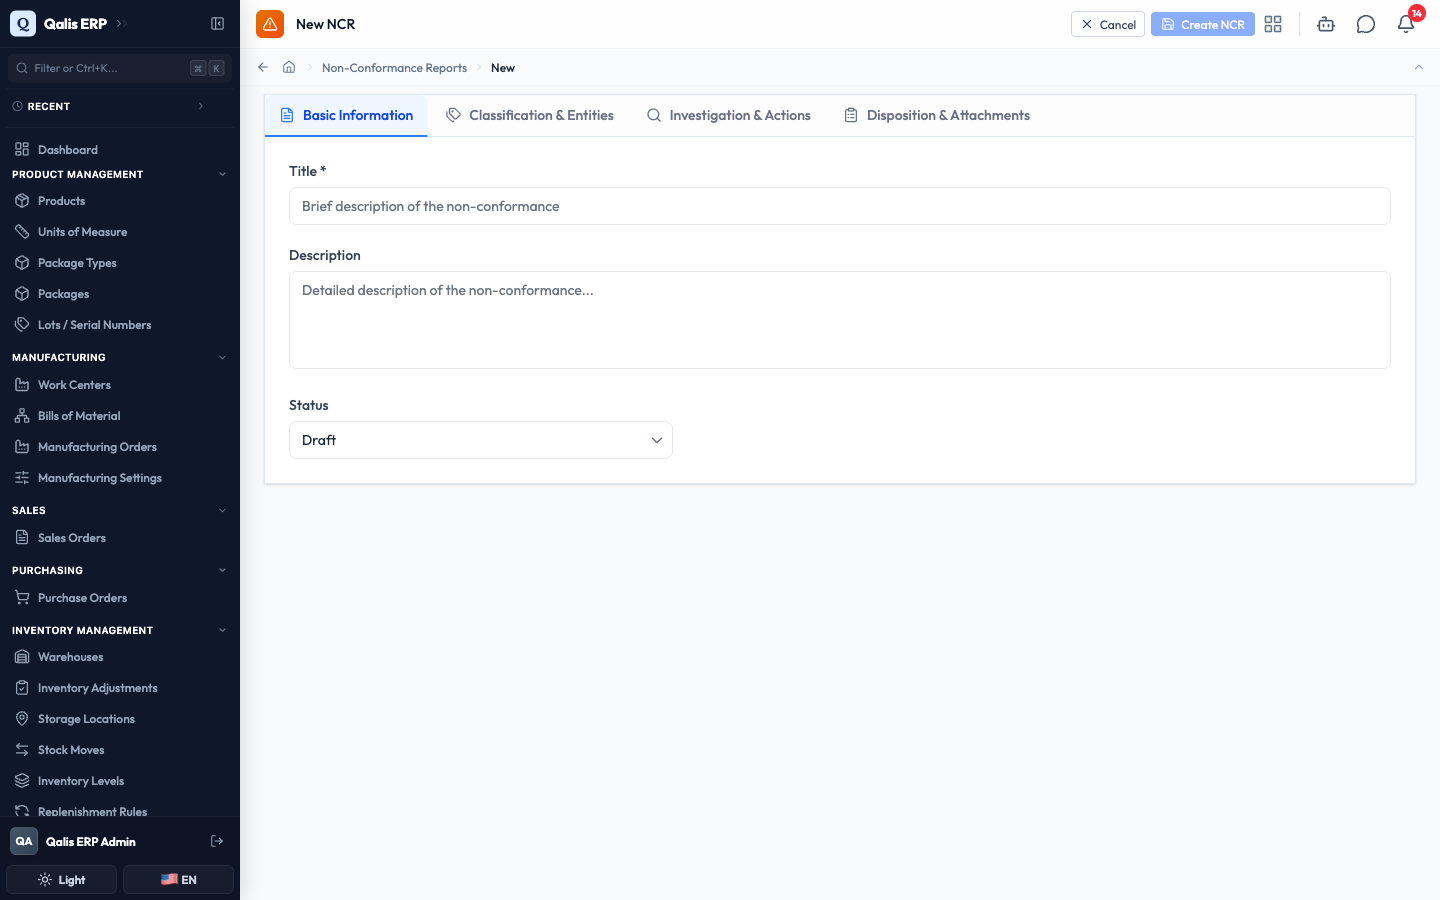
You only see the shortcuts you are allowed to use. If you cannot create a certain kind of record, its shortcut will not appear.
Follow recent activity
The Recent Activity feed is a running log of what people have been doing across the system: who did what, to which record, and when.
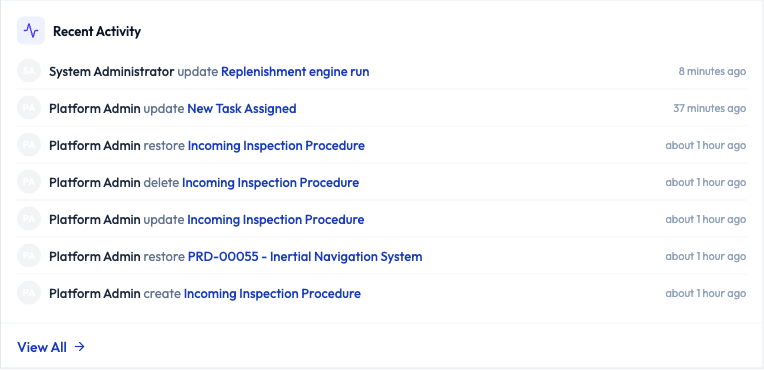
- Each line names the person, the action (created, updated, deleted, restored), and the record involved.
- Click the highlighted record name to open it.
- Click View All at the bottom to open the full audit log.
See more from your modules
Below the main area, some modules add their own summary panels. These appear automatically based on which modules your organization uses, so you may see a different mix.
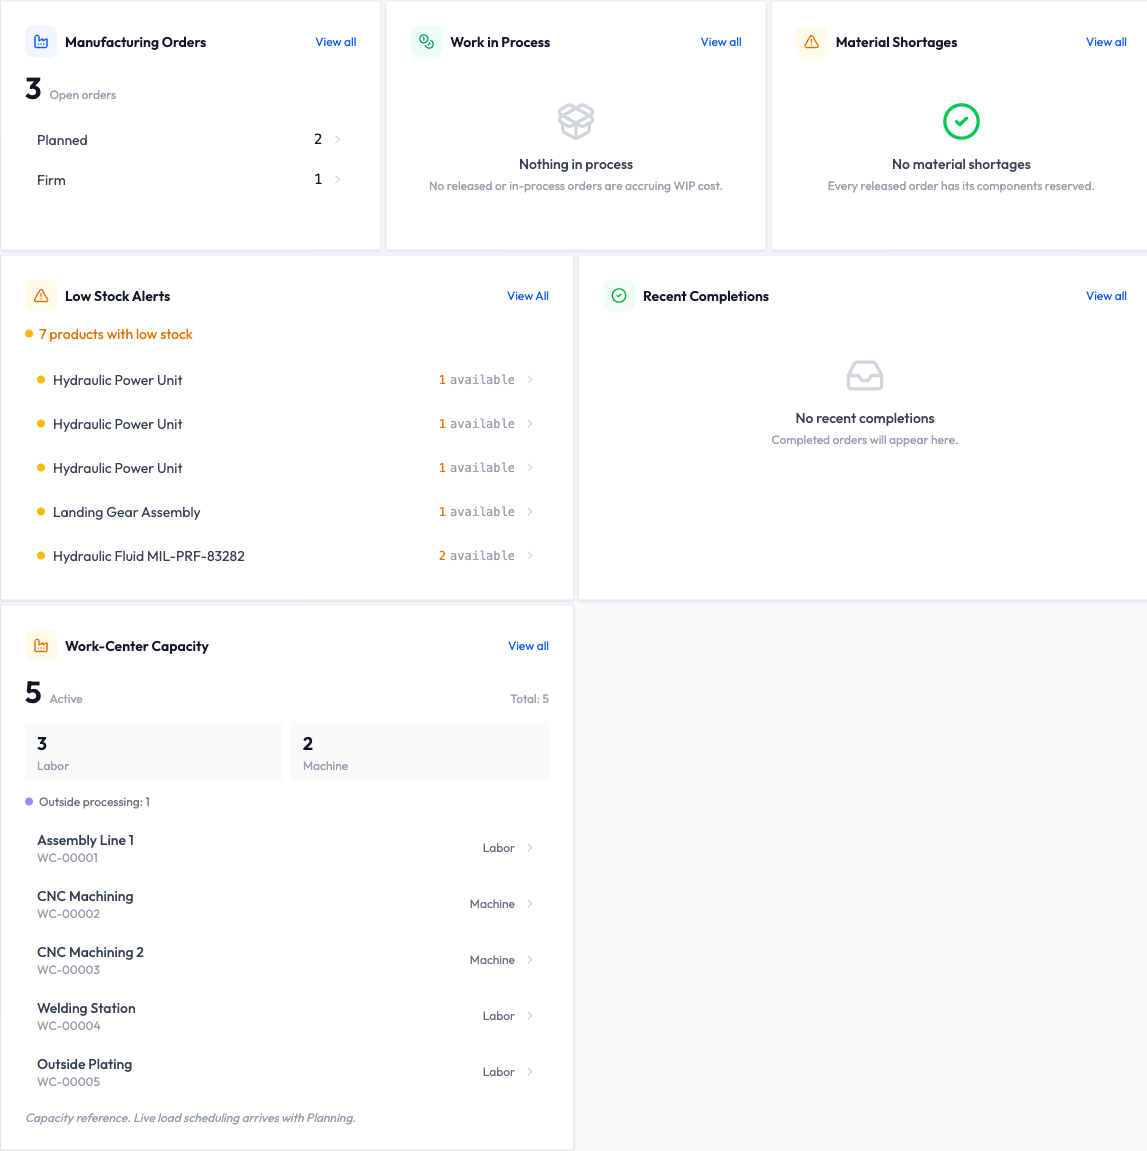
Common ones include:
- Manufacturing Orders: how many production orders are open, split by stage.
- Work in Process: the value tied up in jobs currently on the shop floor.
- Material Shortages: released orders that are short on parts.
- Low Stock Alerts: products running low, with how much is left.
- Recent Completions: the most recently finished production orders.
- Work-Center Capacity: how many work centers are active and how they measure capacity.
Each panel has a View all link that takes you to the full list for that area.
Good to know
A few terms you will meet on the dashboard:
- KPI: a "key performance indicator", which is just an important number worth watching.
- NCR: a non-conformance report, raised when something does not meet requirements.
- CAPA: a corrective and preventive action, the follow-up work to fix and prevent an issue.
- Lot: a batch of items produced or received together, often with an expiry date.
- Work in process: the value of jobs that have been started but not yet finished.
Remember that the dashboard only ever shows what you are allowed to see. If a number, chart, or panel is missing compared to a colleague's screen, it usually means that area is either switched off for your organization or outside your permissions.